
As an information services business, our main environmental impact is the carbon footprint generated from our operations and value chain. Most of our footprint (around 97%) is made up of Scope 3 greenhouse gas emissions, particularly in the category of Purchased Goods and Services, with Scope 1 and 2 emissions from our direct operations making up the remaining 3%.
We are committed to reducing our carbon emissions in line with our science-based target, validated by the Science Based Target initiative (SBTi), and we are committed to becoming carbon neutral in our own operations by 20301. We recognise the urgent need to accelerate action on climate change, and want to further our ambitions towards net zero2. During the coming year, we will develop our plans to decarbonise our operations even further and transition to net zero.
Our Task Force on Climate-Related Financial Disclosures (TCFD) statement below sets out our commitment to mitigating climate-related risks and harnessing opportunities for our products and business to support wider climate action.
TCFD statement
We recognise the importance of identifying and effectively managing the physical and transitional risks that climate change poses to our business, as well as the opportunities that climate change mitigation and adaptation create. In March 2021, Experian became an official supporter of the TCFD.
Last year, we published a reference statement that aligned with most of the recommendations within the TCFD framework. This year, following completion of the scenario analysis, we have reported in alignment with the TCFD recommendations as set out on pages 64 to 73. The scenario analysis performed will lay the foundation for continued, relevant and evolving disclosures (including financial disclosures) as recommended by the TCFD framework.
Governance
The Board oversees our climate strategy (including climate-related risks and opportunities presented in this TCFD statement, along with progress against our science-based target and our carbon neutral commitment) and is responsible for the approval of disclosures in this report. The Global Head of Sustainability is responsible for implementation of our climate action plan, with support and oversight from our ESG Steering Committee, chaired by the Chief Financial Officer.
The Group Operating Committee receives regular updates on our climate action plan and the Chief Executive Officer reports on ESG activities and performance, including those related to climate change, at every Board meeting. These reports include progress on strategic drivers to address climate-related issues, such as our science-based target and TCFD reporting.
The Audit Committee reviews and approves our register of climate-related risks and opportunities and oversees our response, ensuring that the Board has full oversight. Risks are identified and assessed at project and regional level, overseen by the Risk Management Committees that report to the Executive Risk Management Committee (ERMC). See page 85 for more on risk management.
Our environmental management systems help us drive continuous improvements in minimising the environmental footprint of our operations, including climate impact, and ensure we comply with local regulations. Local environmental management systems across the business are aligned with the internationally recognised ISO 14001:2015 standard, and four of our sites – three in the UK and one in Bulgaria – maintain certification to this standard through external audits.
Risk management
We are committed to identifying, assessing and managing risks and opportunities presented by climate change both now and in the future.
Climate-related risks are identified and prioritised using our established Global Risk Management governance structure (outlined on page 85). This well-established process for identifying, assessing, responding to and reporting business risks (see below) is completed at least twice a year to ensure that it remains appropriate and that any new activities or changes to variables have been captured. The framework combines a bottom-up approach – engaging with local subject matter experts who have in-depth knowledge of business activity (First and Second Lines of Defence) – with a top-down global strategic review of risks (Third Line of Defence).
Because of their nature, climate-related risks can be presented to the organisation in different ways (for example: through policy and regulation, product adaptation, operational disruption, market volatility and other external factors), and therefore to ensure a thorough analysis and identification we ran a series of focus groups with internal stakeholders from areas where key climate-related risks could arise. This supported the process of identification of any specific risks to, and opportunities for, our business. The resulting climate-specific risks and opportunities register was used to perform a scenario analysis (see pages 65-67) to assess their likelihood and impact to our business.
Key risks that are identified as a result of this process are maintained in the Global Risk Inventory, reviewed by the ERMC, agreed with by the Audit Committee and presented to the Board. At present, climate change is classified as an emerging risk.
Strategy
We recognise the potential for climate-related risks and opportunities to affect our business, and we are following the TCFD recommendations to help us assess these.
We have reviewed the climate risks and opportunities that exist across our business lines, and across the regions in which we operate, by engaging with key internal stakeholders. This process has enabled us to create a comprehensive climate risk and opportunity register identifying a wide range of physical and transitional climate-related risks and opportunities across short- (one to two years), medium- (two to five years) and long-term (five or more years) timeframes. This climate-specific risk and opportunity register has been developed in accordance with our Global Risk Management framework to ensure the review was performed as a fully integrated process.
We previously identified eight climate-related risks and four climate-related opportunities that are material to our business, based on a high-level assessment of their likelihood and the potential severity of their impact on the business. More detail on this initial assessment is published on page 54 of our Annual Report 2021.
The material risks are defined as those that have the potential to have a significant effect on our operations, strategy or financial performance if they are not suitably controlled. The material opportunities are those that have the potential to enhance the financial performance of the business. Our work in this area consisted of a high-level assessment of climate-related risks and opportunities, considering the likelihood of the risk occurring and the severity of the impact on the business.
Scenario analysis
This year, we worked with external experts to conduct a climate scenario analysis. The starting point for our work was to take the risks and opportunities we identified last year and assess them over a longer time period, under two different climate change projections, to understand their potential financial impact.
We used two projections for our climate scenario modelling:
- High-carbon scenario (4°C): A ‘worst-case’ scenario of climate change that projects global greenhouse gas emissions continuing to rise (based on Representative Carbon Pathway, RCP8.5). In this scenario, substantial physical impacts of climate change arise.
- Low-carbon scenario (2°C): An ‘aggressive mitigation’ scenario that limits the global temperature rise to below 2°C (based on the International Energy Agency’s Sustainable Development Scenario). In this scenario, transitional risks predominate.
We used these scenarios to assess our exposure and vulnerability to climate-related risks, demonstrate the resilience of our climate change strategy, and gain a high-level understanding of the financial implications associated with the risks and opportunities under the two different future scenarios. The table below outlines Experian’s climate-related risks and opportunities, and the Overview column below provides insight into the impacts of the risks and opportunities on Experian’s business, strategy and financial planning.
Climate-related financial risks and opportunities for our business
| Risk/Opportunity | Risk/Opportunity | Overview | Maturity of assessment |
| Transition risks | Compliance | Ensuring Experian meets with global and regional climate change commitments |
|
| Product adaptation | Ensuring existing products and services adapt to consumer and client demand on climate change |
| |
| Investor sentiment | Climate change strategy and environmental performance influencing investor decision-making |
| |
| Carbon taxation | Increased costs associated with carbon taxes and increased expenditure on purchased goods and services |
| |
| Climate disclosure | Reputational impact associated with Experian’s climate change commitments, strategy and disclosures |
| |
| Physical risks | Energy demand | Increased operational costs associated with resources to ensure business operation |
|
| Extreme weather events | Disruption to demand for products and services associated with extreme weather events |
| |
| Climate migration | Markets disrupted by climate-related weather events |
| |
| Opportunities | New service lines | Developing solutions to take to market that minimise the impact of climate change |
|
| New markets | Adaptation to climate change means new markets for solutions are created |
| |
| Access to finance | Increased ability to access credit and funds through strong ESG credentials |
| |
| Low-carbon transition | Offering products and services to support consumers and businesses in their transition to the low-carbon economy |
|


Transition risks by time horizon and climate scenario
| Aspect | Financial impact | Scenario | Financial impact over time horizon | ||
| Pre 2025 | 2025-2030 | 2030+ | |||
| Compliance | Investor and consumer investment | Low carbon |
|
|
|
| High carbon |
|
|
| ||
| Product adaptation | Customer and consumer purchasing behaviour | Low carbon |
|
|
|
| High carbon |
|
|
| ||
| Investor sentiment | Reputational impact associated with lack of climate action | Low carbon |
|
|
|
| High carbon |
|
|
| ||
| Carbon taxation | Increased operational cost from operating infrastructure | Low carbon |
|
|
|
| High carbon |
|
|
| ||
| Climate disclosure | Shareholder expectation on delivering climate change commitments | Low carbon |
|
|
|
| High carbon |
|
|
| ||


Transition risks could present a significant challenge to our business and we are committed to mitigating their potential impacts. Our high-level analysis highlighted that our climate action plan is critical to demonstrating strong climate stewardship and progress towards our carbon neutral commitment, and our approach to carbon reduction and transparent climate disclosures is of paramount importance to our stakeholders.
Physical risks by time horizon and climate scenario
| Aspect | Financial impact | Scenario | Financial impact over time horizon | ||
| Pre 2025 | 2025-2030 | 2030+ | |||
| Energy demand | Increased operational cost associated with meeting energy demand for infrastructure including data centres | Low carbon |
|
|
|
| High carbon |
|
|
| ||
| Extreme weather events | Disruption to business operations from impact of climate change | Low carbon |
|
|
|
| High carbon |
|
|
| ||
| Climate migration | Customers and consumers are affected by chronic effects of climate change resulting in disrupted markets | Low carbon |
|
|
|
| High carbon |
|
|
| ||
Our operating model has proven to be resilient to significant physical disruption, as experienced since the onset of the COVID-19 pandemic. We currently operate a small number of regional data centres that are business-critical assets and exposure to extreme weather events is already considered from a business continuity and disaster recovery perspective.
The most critical physical risk to our business relates to the chronic effects of climate change and impacts from extreme weather events that could lead to climate migrations, which may result in consumers becoming financially excluded as a result of being unable to access their data and demonstrate their financial identities. These impacts are most significant under the high-carbon scenario we modelled. Our planned regional analysis will help us determine areas that are particularly vulnerable to the physical effects of climate change.
Opportunities by time horizon and climate scenario
| Aspect | Financial impact | Scenario | Financial impact over time horizon | ||
| Pre 2025 | 2025-2030 | 2030+ | |||
| New service lines | Increased revenue associated with the delivery of new propositions | Low carbon |
|
|
|
| High carbon |
|
|
| ||
| New markets | Access to new markets as populations migrate as a result of climate change | Low carbon |
|
|
|
| High carbon |
|
|
| ||
| Access to finance | Increased ability to access credit and funds through strong ESG credentials | Low carbon |
|
|
|
| High carbon |
|
|
| ||
| Low-carbon transition | Improved reputation and operational revenues from facilitating the transition to a low-carbon future and mitigating the effects of climate change | Low carbon |
|
|
|
| High carbon |
|
|
| ||
The climate-related opportunities for our business are greater within the low-carbon future scenario we modelled, as they relate to the potential of our business to support and facilitate the transition to a low-carbon future. Demonstrating how these opportunities can translate into financial performance has the potential to improve our ESG credentials with investors and ESG ratings agencies, and influence our ability to attract and retain investors.
Our next step on the TCFD journey is to analyse the specific impact of climate-related risks and opportunities in relation to the products and services we provide and the regions where we operate. This will help to ensure we take a proactive, consistent and embedded approach to mitigating risks and capitalising on opportunities across our business.
We also plan to develop our approach and methodology for the financial quantification of climate-related risks and opportunities. We understand that this is just the beginning of our journey and recognise its importance in informing our climate change strategy.
Metrics and targets
Our climate change strategy is underpinned by our commitment to become carbon neutral in our own operations by 2030.
Our climate goals
- Become carbon neutral in our own operations by 20301:
- Scope 1 and 2 (1.5ºC scenario): reduce absolute Scope 1 and 2 emissions by 50% by 2030 (from 2019)
- Scope 3 (2ºC scenario): reduce absolute Scope 3 emissions from Purchased Goods and Services, Business Travel, and Fuel-and-energy-related activities2 by 15% by 2030 (from 2019)
- Offset 100% of our Scope 1 and 2 emissions by 2025
We use these metrics and targets to assess and manage relevant climate-related risks and opportunities associated with our operational performance.
We recognise the importance of climate change to our stakeholders and the increasing emphasis on achieving net zero emissions globally, following the COP26 climate conference and the latest report from the Intergovernmental Panel on Climate Change. We want to further our ambition and commitment towards net zero and, in the coming year, we will develop our plans to decarbonise our operations even further and transition to net zero as defined by the most recent standard from the Science Based Target initiative.
We measure and publicly report Experian’s carbon footprint with certain data, subject to assurance (see page 69). This year, we reduced our Scope 1 and 2 emissions by a further 1% to 16.4 thousand tonnes of CO2 equivalent (CO2e). Since 2019, we have achieved a 44% reduction in Scope 1 and 2 emissions, on our way to achieve a 50% reduction by 2030 and meet our science-based target.
This reduction was due to the combination of various factors, including intermittent closure of our offices as a result of localised COVID-19 restrictions, embracing new flexible ways of working that have resulted in a decrease in building occupancy, and consolidation and reduction of office space.
To enable the delivery of our Scope 1 and 2 science-based target, we have worked with colleagues across the business to identify opportunities to reduce our operational emissions. This year, the focus was on using our office space smartly and reducing our overall building footprint where flexible working has reduced the demand for office space.
We will continue to invest in energy efficiency projects and technologies for our assets around the world, and source more renewable electricity. We cut the carbon intensity of our direct emissions3 by 16% this year to 2.6 tonnes of CO2e per US$1m of revenue.
To achieve our Scope 3 target, our main focus is on engaging with suppliers to reduce the footprint of the products and services we buy, which make up 77% of our Scope 3 emissions. We are embarking on a process to gather actual Scope 3 emissions data from our suppliers, but since this is not currently available, we have followed common best practice to estimate our Purchased Goods and Services emissions category using an Extended Economic Input-Output (EEIO) model that uses expenditure data. Our reporting methodology for this calculation can be found on our website.
Based on this estimate, our combined Scope 3 emissions over the selected categories of our science-based target (namely Purchased Goods and Services, Business Travel, and Fuel-and-energy-related activities) for FY22 show an increase of 2% compared with the 2019 baseline. This rise in emissions is due to an increase in expenditure as a result of business growth (29% revenue growth across our regions over the last three years). As our science-based target is an absolute target, we are committed to cutting total emissions despite the business growing. We are engaging with our suppliers to understand how they can reduce their emissions and, if required, will switch to suppliers that can better support our target. As this process takes time, we expect some increases in emissions before our initiatives begin to deliver reductions. However, we remain committed to delivering a 15% reduction in these Scope 3 emissions by 2030.
Moving forward we have identified the top 200 carbon-intensive suppliers based on spend and we plan to use data from CDP (formerly known as Carbon Disclosure Project) to update our estimates with actual data from suppliers. This will allow us to recalibrate our figures and get a more accurate scale of the footprint in the Purchased Goods and Services category of Scope 3 emissions.
In FY22, we signed up to participate in the CDP Supply Chain Programme to progress our work with our top 200 suppliers globally and ensure our climate change commitments are reflected and amplified across our value chain. Our supply chain plays an important role in achieving our carbon reduction target for Scope 3 and we are keen to explore opportunities that can help to accelerate our decarbonisation plan. Through the CDP Supply Chain Programme, we will engage with suppliers to understand their climate strategy (including science-based targets and net zero carbon reduction plans where relevant), review their performance and identify ways to reduce the carbon intensity of the products and services we purchase from them.
This year, we were included on the CDP Supplier Engagement Leaderboard 2021, ranking among the top 8% of companies for supplier engagement on climate. This is based on our ‘A’ Supplier Engagement Rating, outperforming the ‘B-’ average for both the Europe region and the global specialised professional services sector.
Once we have achieved our science-based target and reduced our emissions as far as possible, we will invest in high-quality carbon offsetting projects to offset the remaining Scope 1, 2 and 3 emissions within the boundaries of our science-based target to achieve carbon neutrality in our own operations by 2030. To support this journey, as part of our secondary carbon offsetting commitment, we offset 20% of our FY21 Scope 1 and 2 emissions and are offsetting 40% of our remaining FY22 emissions. We will gradually increase this to offset 100% of our Scope 1 and 2 emissions by 2025.
By tracking and disclosing these metrics and targets we make sure we continuously assess and manage some of our key climate-related transitional risks (particularly compliance with climate change commitments, investor sentiment associated with our environmental performance and climate disclosure as mandated and/or expected by stakeholders) and the physical risk of energy demand as outlined on the ‘Climate-related financial risks and opportunities for our business’ table on page 65.
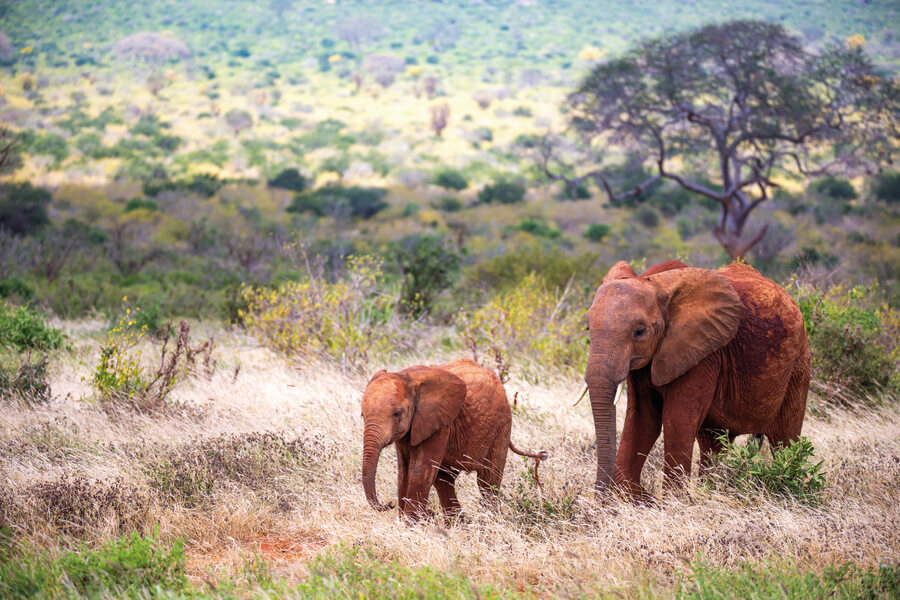
The Kasigau REDD+ Project Phase II – The Community Ranches – from Wildlife Works is the first project in the world to issue REDD+ carbon offsets under the VCS standard, and is also certified with Climate, Community and Biodiversity (CCB) Gold Level.
This year, we invested in a Verified Carbon Standard (VCS) offsetting project in Kenya that will not only avoid carbon emissions, but also support climate adaptation, promote biodiversity, bring added value to communities and contribute to 11 of the 17 United Nations Sustainable Development Goals. The Kasigau REDD+ Project Phase II – The Community Ranches – from Wildlife Works is the first project in the world to issue REDD+ carbon offsets under the VCS standard, and is also certified with Climate, Community and Biodiversity (CCB) Gold Level. The project aims to protect more than 500,000 acres of Kenyan forests under threat from cattle farming by providing communities with alternative income opportunities, training wilderness guardians, and securing a wildlife migration corridor between the Tsavo East and Tsavo West national parks.
Cutting out single-use plastics
In 2020, we committed to eliminating as much single-use plastic as possible in Experian-controlled facilities within two years, but action was postponed as the number of people working in our facilities was significantly reduced during the COVID-19 pandemic. Over the last year, we have assessed the impact of changes in working patterns on our use of single-use plastics.
Based on an assessment of expenditure on single-use plastic in our controlled facilities for the last three years (where available)1, we found that 99% of single-use plastic items we buy are related to food and drink2. Hot drink cups, stirrers and coffee/milk pods3 – our top three single-use plastic items – make up 86% of the total.
By removing or replacing these three items, we anticipate that we could achieve a reduction of over 70% in total single-use plastic from all reporting sites (based on the initial data gathered from our largest sites in the USA and Brazil). Some non-plastic alternatives have already been introduced in key locations.
We have developed a single-use plastic pilot programme to refine and validate our assessment through audits and interviews, establish an accurate baseline that factors in flexible working and new waste streams resulting from the pandemic, and enable reliable scaling. It will be implemented in the coming year at some of our largest sites (based on headcount) across our regions.
The pilot programme will help us gather local insights on ways to phase out specific types of single-use plastic items that will inform a roadmap for action.

CDP Supplier Engagement Rating (SER): ‘A’ rating. Experian was recognised as a Supplier Engagement Leader in the 2021 CDP Supplier Engagement Leaderboard –the top 8% of companies who completed the full climate questionnaire in 2021
Financial Times: Experian was identified as one of Europe’s Climate Leaders 2022 by the Financial Times and Statista
Carbon emissions
| CO2e1 | Unit | 2022 | 20215 | 2020 | 2019 |
| Scope 1 | 000s tonnes CO2e | 2.5ª | 2.2 | 3.0 | 3.6 |
| Scope 2 (location-based)2 | 000s tonnes CO2e | 21.1ª | 22.2 | 25.5 | 29.8 |
| Scope 2 (market-based)3 | 000s tonnes CO2e | 13.9 | 14.3 | 22.1 | 25.6 |
| Total Scope 1 and Scope 2 (market-based) | 000s tonnes CO2e | 16.4 | 16.5 | 25.1 | 29.2 |
| Scope 3 (Purchased Goods and Services) | 000s tonnes CO2e | 412.0ª | 350.9 | 378.9 | 357.4 |
| Total Scope 3 | 000s tonnes CO2e | 532.9 | 453.9 | 493.4 | 495.3 |
| Total emissions4 | 000s tonnes CO2e | 549.3 | 470.4 | 518.5 | 524.5 |
| Total emissions4 normalised by revenue – per US$1m revenue | tonnes CO2e/US$1m revenue | 87.4 | 87.6 | 100.1 | 107.9 |
1 CO2e emissions exclude any carbon offsets purchased by Experian.
2 We have calculated location-based Scope 2 emissions using the International Energy Agency (IEA) carbon emission factors for electricity.
3 We have calculated marked-based Scope 2 emissions using electricity supplier emission factors where available. Where these were not available, we used residual emission factors. If residual factors were not available we used location-based factors.
4 Including Scope 1, Scope 2 (market-based) and total Scope 3.
5 The reporting methodology for 2021 is available at https://www.experianplc.com/media/4259/experian-sustainable-business-performance-data-2021.pdf.
ª The 2022 data for Scope 1, Scope 2 (location-based) and Scope 3 (Purchased Goods and Services) emissions have been subject to limited assurance by PwC. Please refer to our 2022 Carbon Reporting Principles and Methodologies document and PwC’s limited assurance report at https://www.experianplc.com/responsibility/data-and-assurance/.
Sources of Scope 3 emissions relevant to our business
| Sources of Scope 3 emissions | Unit | 2022 | 2021 | 2020 | 2019 | 2022 contribution to Scope 3 (%) |
| Purchased Goods and Services1 | 000s tonnes CO2e | 412.0 | 350.9 | 378.9 | 357.4 | 77.3% |
| Fuel-and-energy-related activities1 | 000s tonnes CO2e | 6.3 | 3.9 | 4.2 | 6.2 | 1.2% |
| Business travel1 | 000s tonnes CO2e | 1.8 | 0.32 | 15.2 | 49.1 | 0.3% |
| Upstream leased assets | 000s tonnes CO2e | 45.3 | 35.4 | 31.0 | 17.5 | 8.5% |
| Capital goods | 000s tonnes CO2e | 40.8 | 40.4 | 31.4 | 31.2 | 7.7% |
| Employee commuting | 000s tonnes CO2e | 17.8 | 13.7 | 24.8 | 24.6 | 3.3% |
| Investments | 000s tonnes CO2e | 8.6 | 8.9 | 7.7 | 4.3 | 1.6% |
| Waste generated in operations | 000s tonnes CO2e | 0.3 | 0.4 | 0.2 | 5.2 | 0.1% |
| Total Scope 3 | 000s tonnes CO2e | 532.9 | 453.9 | 493.4 | 495.3 | |
| Subset of emissions within Scope 3 science-based target (Purchased Goods and Services, Business Travel, and Fuel-and-energy-related activities) | 000s tonnes CO2e | 420.1 | 355.1 | 398.3 | 412.6 |
1 Scope 3 emissions within science-based targets.
2 Only covers emissions from air travel.
Streamlined Energy and Carbon Reporting (SECR) Disclosure
| SECR indicator | Unit | 2022 | 2021 |
| Scope 1: Global (excluding UK) | 000s tonnes CO2e | 2.0 | 1.9 |
| Scope 1: UK | 000s tonnes CO2e | 0.5 | 0.3 |
| Scope 2 (location-based): Global (excluding UK) | 000s tonnes CO2e | 16.7 | 16.8 |
| Scope 2 (location-based): UK | 000s tonnes CO2e | 4.4 | 5.4 |
| Total Scope 1& 2 (location-based): Global (excluding UK) | 000s tonnes CO2e | 18.7 | 18.7 |
| Total Scope 1& 2 (location-based): UK | 000s tonnes CO2e | 4.9 | 5.7 |
| Energy consumption used to calculate above emissions: Global (excluding UK) | kWh | 50,859,896 | 51,154,107 |
| Energy consumption used to calculate above emissions: UK | kWh | 24,358,946 | 25,401,992 |
| Total emissions normalised by revenue – per US$1m revenue: Global (excluding the UK) | tonnes CO2e/US$1m revenue | 3.4 | 4.0 |
| Total emissions normalised by revenue – per US$1m revenue: UK | tonnes CO2e/US$1m revenue | 5.9 | 7.7 |
Specific to SECR disclosure: Experian does not have any ‘offshore’ operations. Therefore, where the ‘UK’ is referenced in the indicators above, it is the same as ‘UK and offshore’.

Governance of ESG
We believe that strong ESG performance can be a source of competitive advantage. Our ESG strategy helps us set targets and commitments, drive progress, and enhance transparency through our ESG reporting and disclosures.
The Chief Financial Officer acts as executive sponsor of our overall ESG programme, which focuses on ESG opportunities and risks, and the Company Secretary oversees the Group’s Sustainability function. They both sit on the Executive Risk Management Committee that oversees how we manage risks globally, including ESG risks, with oversight from the Audit Committee of the Board.
We have established a dedicated ESG Steering Committee, comprising executive sponsors and workstream leaders, that meets regularly to drive our ESG agenda. Chaired by the Chief Financial Officer, the steering committee is responsible for developing our ESG strategy, metrics and targets, as well as overseeing and prioritising investment decisions to support implementation of our ESG programme. Our Chief Sustainability Officer is responsible for ensuring successful delivery of our ESG plans across all our workstreams.
A central team and a network of regional corporate responsibility leads, specialists and steering groups across the business manage our Social Innovation, community investment, health and safety, and environmental programmes and impact. The Board oversees our ESG strategy and performance. Each year they have in-depth sessions on our overall ESG strategy as well as detailed annual updates on each of the separate elements of ESG. In addition they receive written updates on key elements of our ESG performance ahead of every Board meeting.
Certain non-financial metrics – including employee engagement, diversity and inclusion, ESG considerations and risk – are factored into the holistic assessment of the Company’s short- and longer-term performance. We are considering how important aspects of ESG could feature in our remuneration arrangements (see page 128).
Embedding ESG in innovation
Our innovation culture puts consumer and client needs first, and we have strict processes to ensure we build critical ESG considerations, such as data security, privacy and accuracy, into our products and services. We extend our high standards to suppliers through our third-party risk management framework.
Through our Social Innovation programme (see page 49), we invest in developing new products that are specifically designed to offer additional societal benefits as well as creating revenue for our business. The funding model for social innovation products is aligned with our global innovation framework.
The Social Innovation programme is governed by a global steering committee that is facilitated by the Global Head of Social Innovation and was chaired by the Managing Director of Global Decision Analytics this year. The steering committee also includes our Chief Sustainability Officer, Chief Investment Officer, and Company Secretary, as well as senior representatives from each region. A sub-committee governs lower-level funding of early-stage ideas to explore their feasibility.
Managing ESG risks
The Board and our Executive Risk Management Committee review our principal risks on an ongoing basis. Five of our nine principal business risks are relevant to ESG (see table below). In addition, we continue to identify and analyse emerging risks including those related to ESG, such as climate risks (see page 64).
See page 86 for more on our principal risks and risk management processes, including our Three Lines of Defence approach.